Note
Click here to download the full example code
Compute connecivity matrices and graph properties from nii files
The nii_to_graph pipeline performs graph analysis from functional MRI file in NIFTI format.
The input data should be preprocessed (i.e. realigned, coregistered, and segmented), and normalized in the same space (e.g. MNI space) as the template used to define the nodes in the graph.
The data used in this example are the anat and func from the sub-01 in the OpenNeuro database ds000208_R1.0.0, after preprocessing realized with Nipype pipeline create_preprocess_struct_to_mean_funct_4D_spm12, with parameters:
- TR = 2.5,
- slice_timing = False
- fast_segmenting = True
- fwhm = [7.5,7.5,8]
- nb_scans_to_remove = 0
The template was generated from the HCP template called HCPMMP1_on_MNI152_ICBM2009a_nlin, by taking a mirror for the right hemisphere and compute a template with 360 ROIS
The input data should be a preprocessed, and in the same space (e.g. MNI space) as the template used to define the nodes in the graph.
# Authors: David Meunier <david_meunier_79@hotmail.fr>

# License: BSD (3-clause)
# sphinx_gallery_thumbnail_number = 2

import os
import os.path as op

import nipype.pipeline.engine as pe

from nipype.interfaces.utility import IdentityInterface
import nipype.interfaces.io as nio

import json  # noqa
import pprint  # noqa
# Check if data are available

from graphpype.utils_tests import load_test_data

data_path = load_test_data("data_nii")

data_path_mask = load_test_data("data_nii_HCP")

ROI_mask_file = op.join(data_path_mask, "indexed_mask-ROI_HCP.nii")
ROI_coords_file = op.join(data_path_mask, "ROI_coords-ROI_HCP.txt")
ROI_MNI_coords_file =op.join(data_path_mask, "ROI_MNI_coords-ROI_HCP.txt")
ROI_labels_file = op.join(data_path_mask, "ROI_labels-ROI_HCP.txt")
Then, we create our workflow and specify the base_dir which tells nipype the directory in which to store the outputs.
# workflow directory within the `base_dir`
conmat_analysis_name = 'conmat'

from graphpype.pipelines import create_pipeline_nii_to_conmat # noqa

main_workflow = pe.Workflow(name= conmat_analysis_name)
main_workflow.base_dir = data_path
Then we create a node to pass input filenames to DataGrabber from nipype
data_nii = json.load(open(op.join(op.dirname("__file__"),"params_nii.json")))
pprint.pprint({'graph parameters': data_nii})

subject_ids = data_nii["subject_ids"]
func_sessions = data_nii["func_sessions"]
conf_interval_prob = data_nii["conf_interval_prob"]

infosource = pe.Node(interface=IdentityInterface(
    fields=['subject_id','session']),
    name="infosource")

infosource.iterables = [('subject_id', subject_ids),
    ('session', func_sessions)]
Out:
{'graph parameters': {'con_den': 0.01,
                      'conf_interval_prob': 0.05,
                      'func_sessions': ['rest'],
                      'radatools_optim': 'WS tfrf 100',
                      'subject_ids': ['01']}}
and a node to grab data. The template_args in this node iterate upon the values in the infosource node
datasource = pe.Node(interface=nio.DataGrabber(
    infields=['subject_id','session'],
    outfields= ['img_file','gm_anat_file','wm_anat_file','csf_anat_file']),
    name = 'datasource')

datasource.inputs.base_directory = data_path
datasource.inputs.template = '%ssub-%s%s%s%s'
datasource.inputs.template_args = dict(
img_file=[["wr",'subject_id',"_task-",'session',"_bold.nii"]],
gm_anat_file=[["rwc1",'subject_id',"",'',"_T1w.nii"]],
wm_anat_file=[["rwc2",'subject_id',"",'',"_T1w.nii"]],
csf_anat_file=[["rwc3",'subject_id',"",'',"_T1w.nii"]],
rp_file=[["rp_",'subject_id',"_task-",'session',"_bold.txt"]],
       )

datasource.inputs.sort_filelist = True
### reasample images, extract time series and compute correlations
cor_wf = create_pipeline_nii_to_conmat(main_path=data_path,
                                       conf_interval_prob=conf_interval_prob,
                                       resample=True, background_val=0.0)

### link the datasource outputs to the pipeline inputs
main_workflow.connect(datasource, 'img_file', cor_wf, 'inputnode.nii_4D_file')
main_workflow.connect(datasource, 'gm_anat_file', cor_wf,
                      'inputnode.gm_anat_file')
main_workflow.connect(datasource, 'wm_anat_file', cor_wf,
                      'inputnode.wm_anat_file')
main_workflow.connect(datasource, 'csf_anat_file', cor_wf,
                      'inputnode.csf_anat_file')
main_workflow.connect(datasource, 'rp_file', cor_wf, 'inputnode.rp_file')

### extra arguments: the template used to define nodes
cor_wf.inputs.inputnode.ROI_mask_file = ROI_mask_file
cor_wf.inputs.inputnode.ROI_coords_file = ROI_coords_file
cor_wf.inputs.inputnode.ROI_MNI_coords_file = ROI_MNI_coords_file
cor_wf.inputs.inputnode.ROI_labels_file = ROI_labels_file
We then connect the nodes two at a time. We connect the output of the infosource node to the datasource node. So, these two nodes taken together can grab data.
main_workflow.connect(infosource, 'subject_id', datasource, 'subject_id')
main_workflow.connect(infosource, 'session', datasource, 'session')
# This parameter corrdesponds to the percentage of highest connections retains # for the analyses. con_den = 1.0 means a fully connected graphs (all edges # are present)
# density of the threshold
con_den = data_nii['con_den']

# The optimisation sequence
radatools_optim = data_nii['radatools_optim']

from graphpype.pipelines import create_pipeline_conmat_to_graph_density ## noqa

graph_workflow = create_pipeline_conmat_to_graph_density(
    data_path, con_den=con_den, optim_seq=radatools_optim)

main_workflow.connect(cor_wf, 'compute_conf_cor_mat.Z_conf_cor_mat_file',
                      graph_workflow, "inputnode.conmat_file")
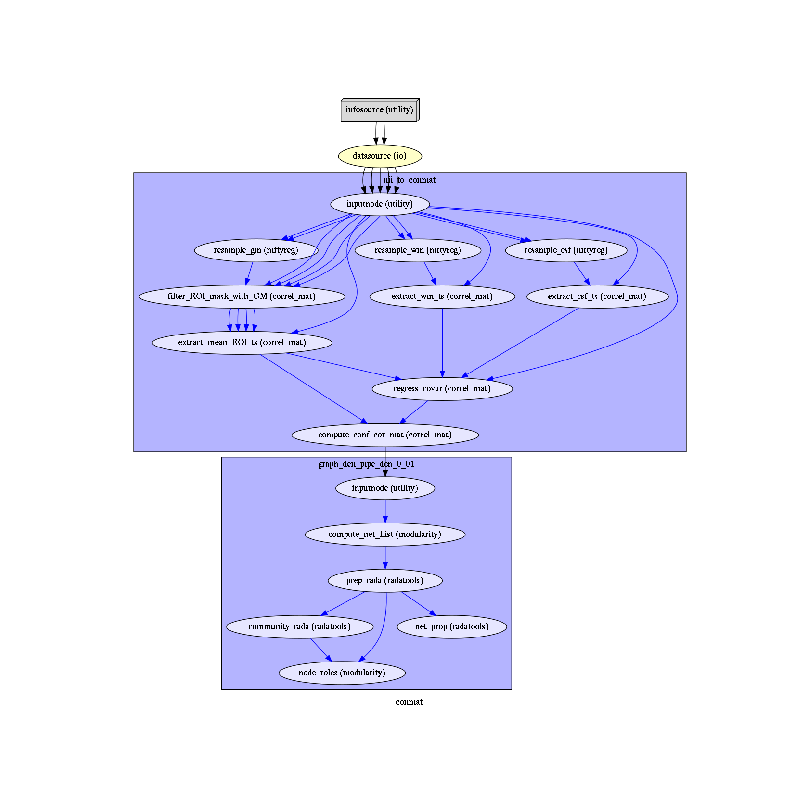
To do so, we first write the workflow graph (optional)
main_workflow.write_graph(graph2use='colored') # colored
and visualize it. Take a moment to pause and notice how the connections here correspond to how we connected the nodes.
import matplotlib.pyplot as plt  # noqa
img = plt.imread(op.join(data_path, conmat_analysis_name, 'graph.png'))
plt.figure(figsize=(8, 8))
plt.imshow(img)
plt.axis('off')
plt.show()

Displaying connectivity Figures
Finally, we are now ready to execute our workflow.
main_workflow.config['execution'] = {'remove_unnecessary_outputs': 'false'}

main_workflow.run()

# Run workflow locally on 2 CPUs
#main_workflow.run(plugin='MultiProc', plugin_args={'n_procs': 2})
Out:
(360, 3)
[  0   1   3   4   5   6   7   8   9  10  11  12  13  14  16  17  18  19
  20  21  22  23  24  25  26  27  28  29  30  31  32  33  34  35  36  37
  39  40  42  51  52  54  55  56  57  58  59  60  61  62  63  64  65  67
  68  69  70  71  72  73  74  75  76  77  78  79  80  81  82  83  84  85
  86  87  88  89  90  91  92  93  94  95  98  99 100 101 102 103 104 105
 106 107 108 109 110 111 112 113 114 115 116 117 118 119 120 121 122 123
 124 125 126 127 128 129 130 131 132 133 134 135 136 137 138 139 140 141
 142 143 144 145 146 147 148 149 150 152 153 154 155 156 157 158 159 160
 161 162 163 164 165 166 167 168 169 170 171 172 173 174 175 176 177 178
 179 180 181 182 183 184 185 186 187 188 189 190 191 192 193 194 195 196
 197 198 199 200 201 202 203 204 205 206 207 208 209 210 211 212 213 214
 215 216 217 219 220 222 223 229 230 231 232 233 234 235 236 237 238 239
 240 241 242 243 244 245 246 247 248 249 250 251 252 253 254 255 256 257
 258 259 260 261 262 263 264 265 266 267 268 269 270 271 272 273 274 275
 278 279 280 281 282 283 284 285 286 287 288 289 290 291 292 293 294 295
 296 297 298 299 300 301 302 303 304 305 306 307 308 309 310 311 312 313
 314 315 316 317 318 319 320 321 322 324 325 326 327 328 329 330 332 333
 334 335 336 337 338 339 340 341 342 343 344 345 346 347 348 349 350 351
 352 353 354 355 356 357 358 359]
Transposing data_matrix shape (332, 300) -> (300, 332)
Transposing data
Computing Pearson correlation
(332, 332)
(101954, 3)
Loading Pajek_net_file for reading node_corres
[[   0 1185 1177 ...    0    0    0]
 [   0    0 1517 ...    0    0    0]
 [   0    0    0 ...    0    0    0]
 ...
 [   0    0    0 ...    0    0    0]
 [   0    0    0 ...    0    0    0]
 [   0    0    0 ...    0    0    0]]
(190,) (190, 190)
Loading community belonging file /home/INT/meunier.d/miniconda3/Packages/graphpype/data/data_nii/conmat/graph_den_pipe_den_0_01/_session_rest_subject_id_01/community_rada/Z_List.lol
[ 1  1  1  1  1  1  3  3  0  1  0  7  3  3  4  3  3  3  4  4  4 10  4 10
  6  6  6  6  6  6  5  5  5  4 11 11  4  7  2  2  2  2  2  2  2  2  4  4
  0  0  0  1  0  7  0  0  0  5  5  0  0  0  0  0  0  5  5  4  4  4  1  8
  3  5  3  1  1  0  1  0  3  1 12  2  2  2  0  2  7  0  0  6  6  1  1  1
  1  1  1 13  1  3  3  1  0  1  0  0  0  8  3  3  4  3  3  3  4  4  4  4
  4 14 14  6  6  6  6  6  6  2 15 15 16 16  3 13  9  2  9  9  2  2  0  2
  2  2  0  0  1  0  9  5  0  0  5  5  0  0  0  0  0  0  0  0  5  5  3  4
  3  1  8  8  3  3  1  1  0  0  0  1  1 12  2  2  2  0  2  5  0  2]
Computing node roles

Node roles:
*Hubs 29/non-hubs 143
*provincials 175/connectors 15
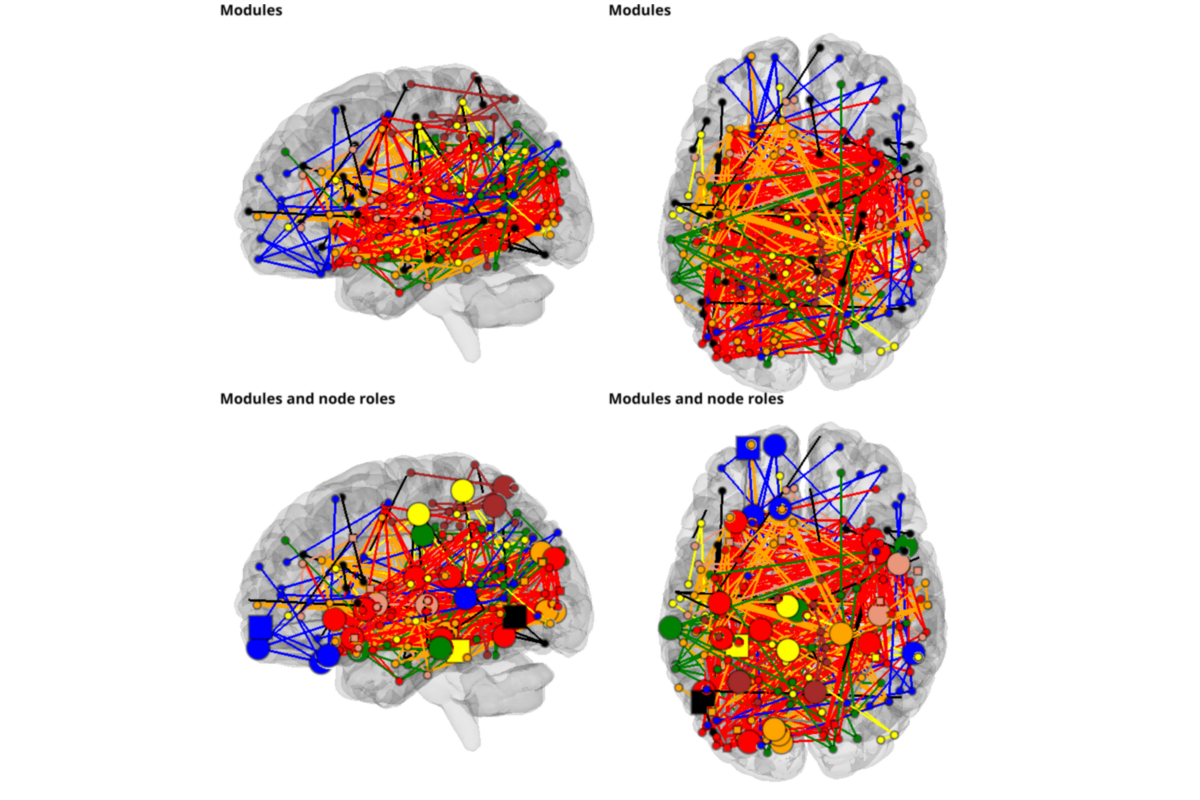
# plotting
from graphpype.utils_visbrain import visu_graph_modules, visu_graph_modules_roles
from visbrain.objects import SceneObj, BrainObj # noqa

sc = SceneObj(size=(1000, 1000), bgcolor=(1,1,1))

res_path = op.join(
    data_path, conmat_analysis_name,
    "graph_den_pipe_den_"+str(con_den).replace(".", "_"),
    "_session_rest_subject_id_01")

lol_file = op.join(res_path, "community_rada", "Z_List.lol")
net_file = op.join(res_path, "prep_rada", "Z_List.net")
roles_file = op.join(res_path, "node_roles", "node_roles.txt")

views = ["left",'top']

for i_v,view in enumerate(views):

    b_obj = BrainObj("B1", translucent=True)
    sc.add_to_subplot(b_obj, row=0, col = i_v, use_this_cam=True, rotate=view,
                        title=("Modules"),
                        title_size=14, title_bold=True, title_color='black')

    c_obj,s_obj = visu_graph_modules(lol_file=lol_file, net_file=net_file,
                                coords_file=ROI_MNI_coords_file,
                                inter_modules=False)

    sc.add_to_subplot(c_obj, row=0, col = i_v)
    sc.add_to_subplot(s_obj, row=0, col = i_v)

    b_obj = BrainObj('B1', translucent=True)
    sc.add_to_subplot(b_obj, row=1, col = i_v, use_this_cam=True, rotate=view,
                    title=("Modules and node roles"),
                    title_size=14, title_bold=True, title_color='black')

    c_obj,list_sources = visu_graph_modules_roles(
        lol_file=lol_file, net_file=net_file, roles_file=roles_file,
        coords_file=ROI_MNI_coords_file, inter_modules=True, default_size=10,
        hub_to_non_hub=3)

    sc.add_to_subplot(c_obj, row=1, col = i_v)

    for source in list_sources:
        sc.add_to_subplot(source, row=1, col = i_v)


sc.preview()

Total running time of the script: ( 0 minutes 58.934 seconds)